Skip to content
Document
Document
  • Language
    • English – EN
    • 한국어 – KO
Document
Document

Log In & Managing Project &Team

  • Log In
  • Making Project
  • Making Team

Testing on various devices

  • Testing Mobile App
  • Testing Web

Viewing Test Results

  • Summary
  • Activity Map
  • Screen
  • Performance
  • Device Log
  • Share Test Results

Scenario Authoring

  • What is Stego?
  • Basic Function
  • Scenario Writing and Execution
  • Action List
  • List of Screen analysis tools

Scenario Authoring tutorial

  • 1. Launch your app with Stego
  • 2. Scroll to find items
  • 3. Google Search by Text Image
  • 4. Zoom in Google Maps
  • 5. How to use Conditional Action
  • 6. Stop/Start a video in YouTube
  • 7. Setting the alarm by scrolling the wheel control
  • 8. Handling a disappearing popup dialog
  • 9. Checking a specific desktop icon
  • 10. Using shared scenarios

Advanced : Running Stego scenario on apptest.ai

  • Testing Scenario

Integration & API

  • Rest APIs
  • Jenkins Integrations
  • Home
  • Performance

Performance

Graph of the system profiling data during the test.

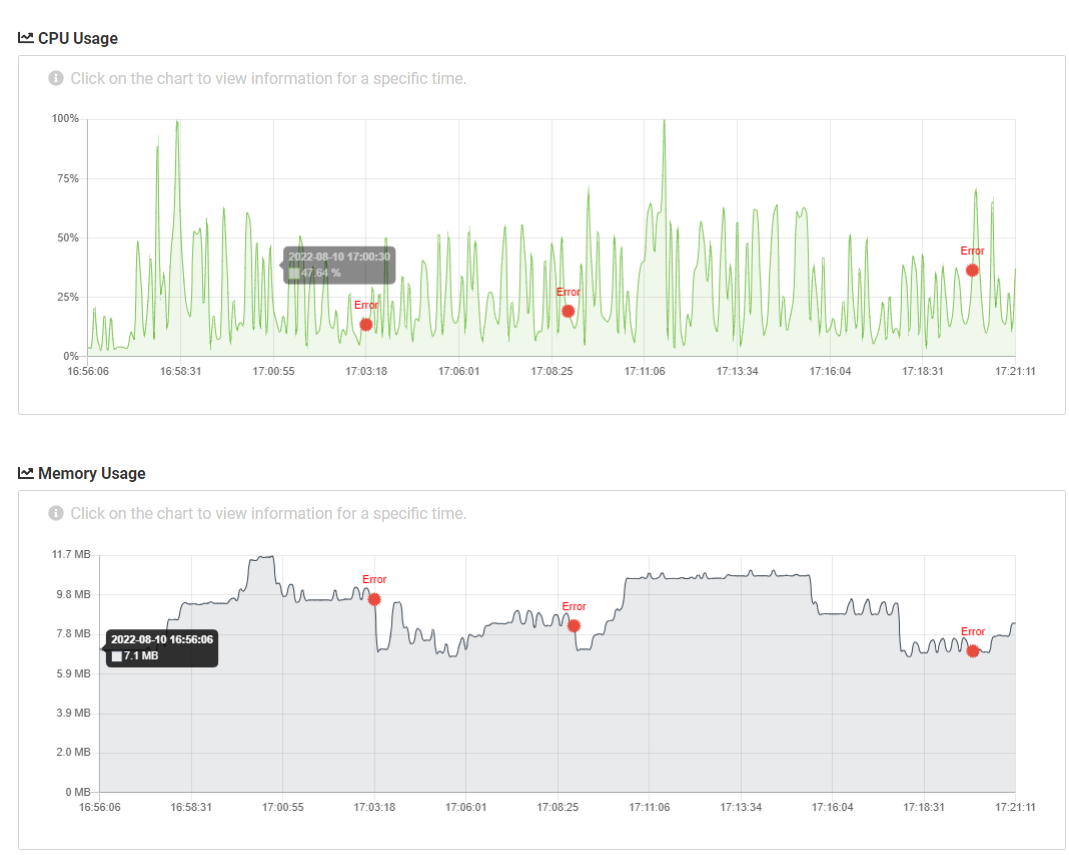
The Performance tab displays CPU utilization and memory utilization that occurred during the test run in graph format.

① Tooltip
Move the mouse cursor over the graph and tooltip will display the timestamp, CPU utilization (in percentage), and memory utilization (MB)
② an error point
If error occurs during a test, the error point is located at the point of time during the graph. Clicking on the desired point opens a pop-up showing the screen thumbnail and device logs for that point.

Still stuck? How can we help?

How can we help?

Updated on 03/01/2023
Device Log
자산 3

apptest.ai. Inc ⓒ 2023 All Rights Reserved

Linkedin Youtube
Contact Info
  • 3003 North First Street , STE 221, San Jose CA (95134)
  • contact@apptest.ai